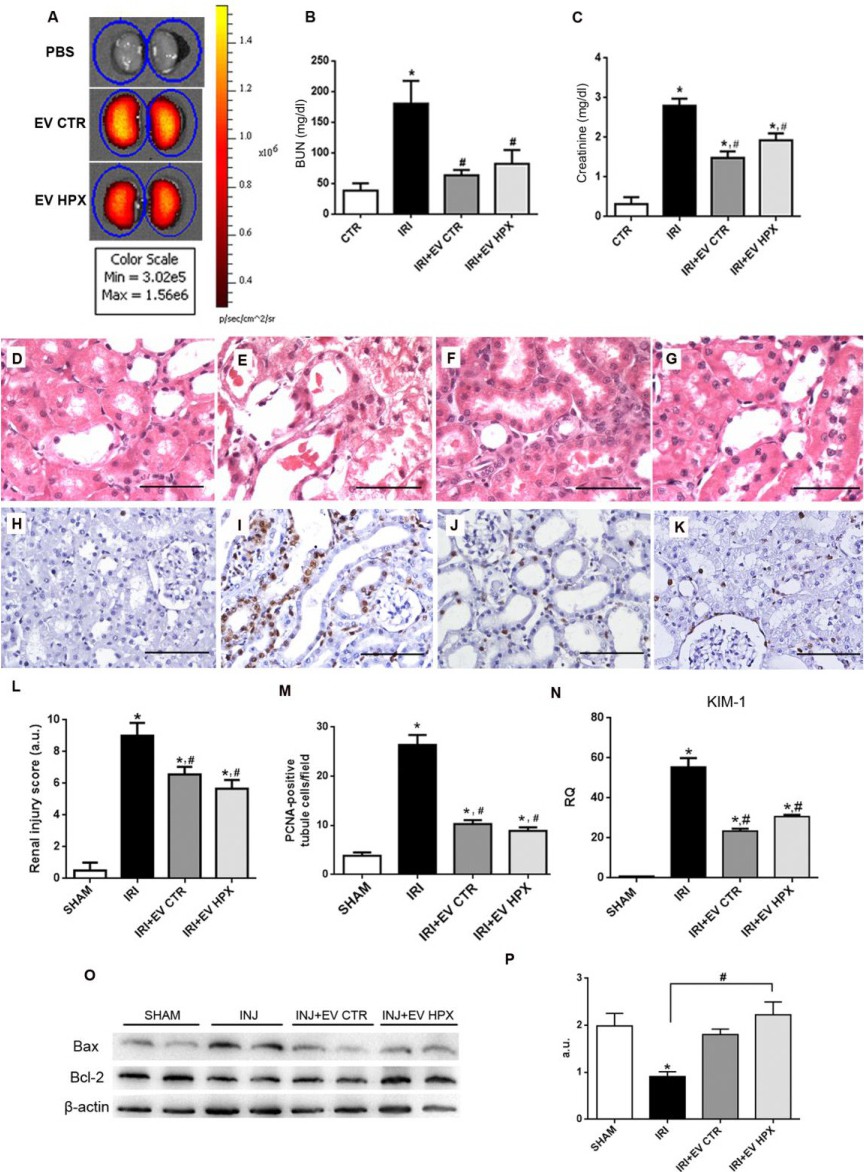
Fig. 5. EVs localization and their renoprotective effects. Fluorescent detection of administered EVs stained with Vybrant DiD. Color scale bar indicates the fluorescence intensity associated with EVs presence. PBS indicates the staining protocol without EVs to exclude possible nonspecific dye signal (A). Measurement of blood BUN (B) and creatinine (C) (n = 8) levels in IRI treated and SHAM animals. Kidney cortical slices stained with H/E: SHAM (D), IRI (E), IRI+EV CTR (F) and IRI+EV HPX (G) (scale bar = 50 µm). Representative photomicrographs of immunohistochemistry for PCNA: SHAM (H), IRI (I), IRI+EV CTR (J) and IRI+EV HPX (K) (scale bar = 100 µm). Histological score of tubular lesions (SHAM, n (kidneys) = 10; IRI, IRI+EV CTR, IRI+EV HPX, n (kidneys) = 12) (L). Number of PCNA-positive cells/field from immunohistochemistry (n = 10 fields for 4 kidneys) (M). KIM-1 mRNA levels in renal tissue expressed as RQ in respect to SHAM group (n = 5) (N). Representative western blot of Bax/Bcl-2 expression in renal tissue (O) and quantification of the ratio Bcl-2/Bax (n = 4) (P). Data represent mean ± SEM. (* indicates statistical difference to SHAM group; # indicates statistical difference to IRI group, P<0.05 assessed by one-way ANOVA followed by Tukey's test). Abbreviations: H/E, hematoxylin/eosin; PBS, phosphate buffered saline; BUN, blood urea nitrogen; EV extracellular vesicles; SHAM, false operate; CTR, control; HPX, hypoxia; IRI, ischemia-reperfusion injury; KIM-1, Kidney Injury Molecule-1; Bcl-2, B-cell lymphoma 2; Bax, Bcl-2 associated X, β-actin, beta-actin; PCNA, proliferating cell nuclear antigen; a.u., arbitrary units; RQ, relative quantification.